

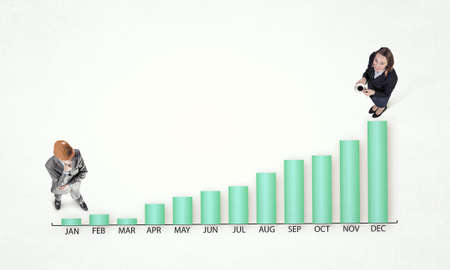
Businessman showing business growth and success graph ,concept of progress in development, financial efficiency and investment with business strategy for goals and opportunities in the industry future
Коллекция по умолчанию
Коллекция по умолчанию
Создать новую

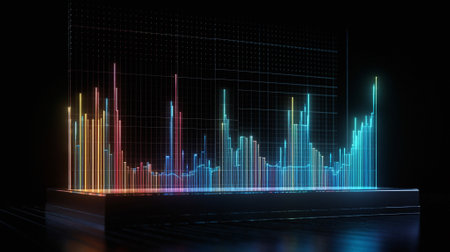
The sleek, illuminated bar graph displays data trends on a glossy table in a contemporary office environment at night, highlighting growth and analysis.
Коллекция по умолчанию
Коллекция по умолчанию
Создать новую
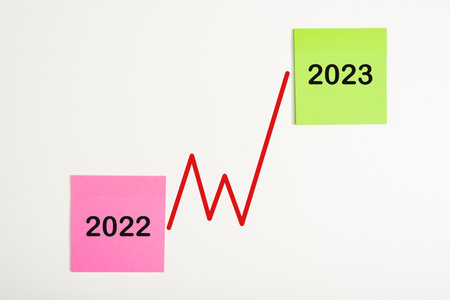
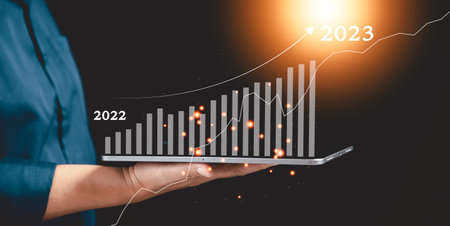
Two stickers memo with text 2022 and 2023, curve red growth chart on white background. Concept of finance, investment.
Коллекция по умолчанию
Коллекция по умолчанию
Создать новую

3d illustration of colorful sound wave on dark background. Music concept, A colorful 3D line graph indicating a rise in stock market, AI Generated
Коллекция по умолчанию
Коллекция по умолчанию
Создать новую

Businessman analysis profitability of working companies with digital augmented reality graphics, positive indicators in 2023, businessman calculates financial data for long term investments.
Коллекция по умолчанию
Коллекция по умолчанию
Создать новую

3d render A series of black bars are stacked on top of each other
Коллекция по умолчанию
Коллекция по умолчанию
Создать новую

Double exposure of forex graph hologram over desktop with phone. Top view. Mobile trade platform concept.
Коллекция по умолчанию
Коллекция по умолчанию
Создать новую

planning and strategy, Stock market, Business growth, progress or success concept. woman with trader is showing a growing virtual hologram stock, invest in trading, analytics and financial concept
Коллекция по умолчанию
Коллекция по умолчанию
Создать новую
Economy trends background for business ideas. Financial graph on technology abstract background represent financial crisis
Коллекция по умолчанию
Коллекция по умолчанию
Создать новую

Poster infographics information business modern design set proposal advert. Vector illustration with graphic scheme
Коллекция по умолчанию
Коллекция по умолчанию
Создать новую
A professional woman, donned in a fitted business suit, as she intently point towards an upward trending stocks chart highlighted on a digital screen.
Коллекция по умолчанию
Коллекция по умолчанию
Создать новую
Image of diagrams and data processing over cityscape. Global technology and digital interface concept digitally generated image.
Коллекция по умолчанию
Коллекция по умолчанию
Создать новую

2024 business target goal finance technology and investment stock market trading concept. businessman holding tablet virtual graph icon analysing forex or crypto currency trading graph financial data.
Коллекция по умолчанию
Коллекция по умолчанию
Создать новую

Stock market graph and top view computer on the table background. Multi exposure. Concept of financial education.
Коллекция по умолчанию
Коллекция по умолчанию
Создать новую

2024 business target goal finance technology and investment stock market trading concept. businessman using laptop virtual graph icon analysing forex or crypto currency trading graph financial data.
Коллекция по умолчанию
Коллекция по умолчанию
Создать новую

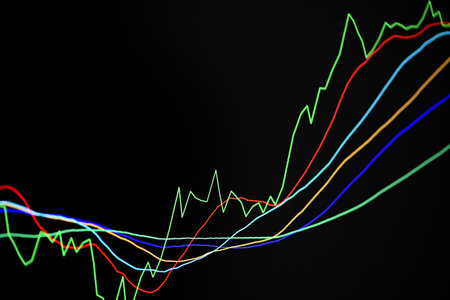
Abstract Colorful Arrow Line Graph Moving Upwards, Upward Trend, Growth, Success on Dark Background
Коллекция по умолчанию
Коллекция по умолчанию
Создать новую
An algorithm predicting market trends based on history
Коллекция по умолчанию
Коллекция по умолчанию
Создать новую

Multi exposure of forex graph hologram over desktop with phone. Top view. Mobile trade platform concept.
Коллекция по умолчанию
Коллекция по умолчанию
Создать новую

Charts Graphs paper. Financial development, Banking Account, Statistics, Investment Analytic research data economy, Stock exchange Business office company meeting concept.
Коллекция по умолчанию
Коллекция по умолчанию
Создать новую
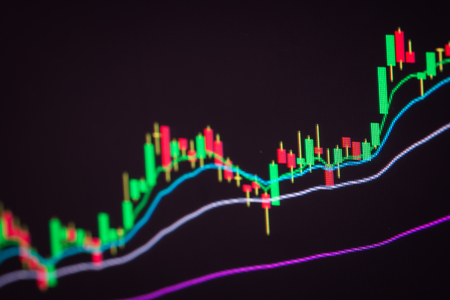
Candle stick graph chart of stock market investment trading.
Коллекция по умолчанию
Коллекция по умолчанию
Создать новую

Businessman pointing at virtual graph target goals year 2023 to 2024. Resolution statistics graph year 2024. Chart plan management economic finance marketing goal future.
Коллекция по умолчанию
Коллекция по умолчанию
Создать новую

3d representation of a blue bar graph with data visualization on a dark background
Коллекция по умолчанию
Коллекция по умолчанию
Создать новую
A bold bar chart with green bars rising sharply and red bars dropping steeply, representing stock market changes, set against a dark gray background.
Коллекция по умолчанию
Коллекция по умолчанию
Создать новую
Business graph with arrow up, vector illustration. Eps 10 vector file.
Коллекция по умолчанию
Коллекция по умолчанию
Создать новую
Chart graph paper. Finance, account, statistic, investment data economy, stock exchange business.
Коллекция по умолчанию
Коллекция по умолчанию
Создать новую

Image of data processing with pink arrow over cells and cityscape. global business and finances, virus pandemic concept digitally generated image.
Коллекция по умолчанию
Коллекция по умолчанию
Создать новую
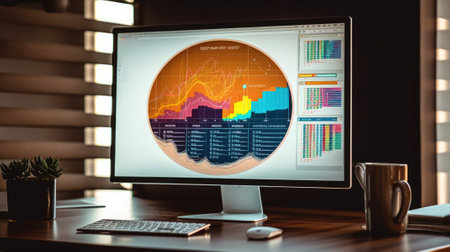
Image of statistical data processing against empty office. Computer interface and business data technology concept
Коллекция по умолчанию
Коллекция по умолчанию
Создать новую
This photo showcases a close up of a wooden table with a clearly visible graph, providing a detailed representation of data, A line graph showcasing cryptocurrency investment trends, AI Generated
Коллекция по умолчанию
Коллекция по умолчанию
Создать новую

Financial graph colorful drawing and table with computer on background. Double exposure. Concept of international markets.
Коллекция по умолчанию
Коллекция по умолчанию
Создать новую
businessman touching pie chart in screen
Коллекция по умолчанию
Коллекция по умолчанию
Создать новую

Image of data processing over landscape. global connections, digital interface and technology concept digitally generated image.
Коллекция по умолчанию
Коллекция по умолчанию
Создать новую
Stock market graphs on the computer monitor.
Коллекция по умолчанию
Коллекция по умолчанию
Создать новую

Business person evaluates metrics for business growth, setting goals for expansion. Insights on fostering continuous business growth through innovation and strategy. FaaS
Коллекция по умолчанию
Коллекция по умолчанию
Создать новую
Startup concept with icon business and network connection on modern virtual interface from digital tablet. People hand touching on tablet. Developing and improving organization with modern technology.
Коллекция по умолчанию
Коллекция по умолчанию
Создать новую
Image of digital interface showing statistics with a world map. Digital interface and global business, digitally generated image
Коллекция по умолчанию
Коллекция по умолчанию
Создать новую

An orange sticker with a growing graph symbolizing business success, growth and increase.
Коллекция по умолчанию
Коллекция по умолчанию
Создать новую
modern infographic vector template with statistics graphs and finance charts. Diagram template and chart graph, graphic information visualization illustration
Коллекция по умолчанию
Коллекция по умолчанию
Создать новую

Dashboard infographic big data visualization, binary option, monitor screen in perspective, statistics and market analysis illustration
Коллекция по умолчанию
Коллекция по умолчанию
Создать новую

Stock market or forex trading graph in graphic concept suitable for financial investment or Economic trends business idea and all art work design.
Коллекция по умолчанию
Коллекция по умолчанию
Создать новую
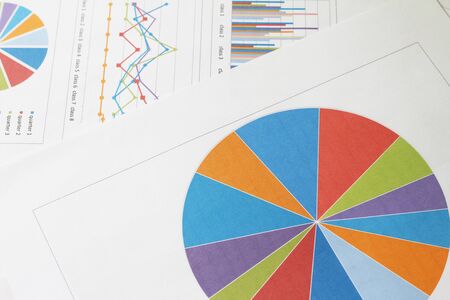
Top view of business people and graphs and diagrams on floor
Коллекция по умолчанию
Коллекция по умолчанию
Создать новую

indicators including volume analysis for professional technical analysis on the monitor of a computer. Fundamental and technical analysis concept.
Коллекция по умолчанию
Коллекция по умолчанию
Создать новую

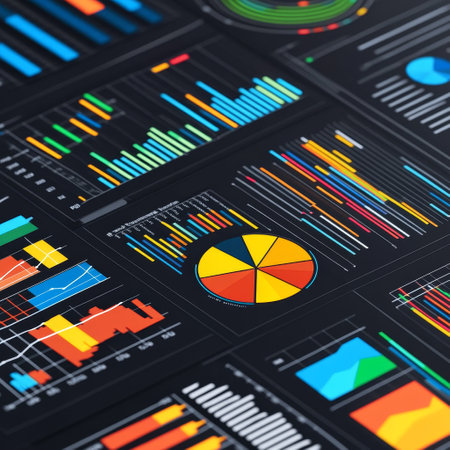
Chart, graph and info graphics 3d design for data analysis, seo tools or statistics background
Коллекция по умолчанию
Коллекция по умолчанию
Создать новую
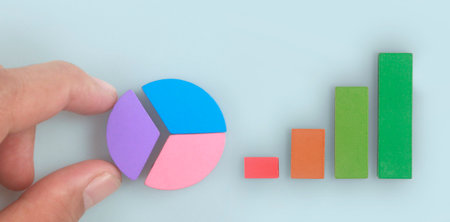
Business connecting piece of multi colored pie chart in a hand
Коллекция по умолчанию
Коллекция по умолчанию
Создать новую
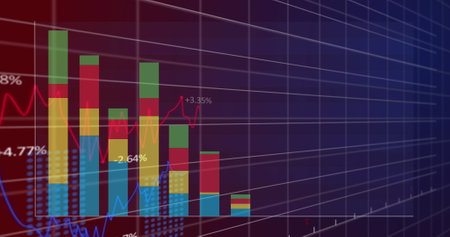
Image of multiple graphs with changing numbers over grid pattern against black background. Digitally generated, hologram, illustration, report, growth, three dimensional and business concept.
Коллекция по умолчанию
Коллекция по умолчанию
Создать новую
workloads data center infographics
Коллекция по умолчанию
Коллекция по умолчанию
Создать новую

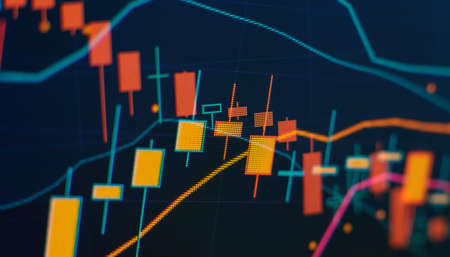
Bullish Rectangle - continuation price chart pattern figure technical analysis. Strong uptrend between two parallel levels. Stock, cryptocurrency graph, forex analytics, trading market breakouts icon
Коллекция по умолчанию
Коллекция по умолчанию
Создать новую
graph chart of stock market investment trading.
Коллекция по умолчанию
Коллекция по умолчанию
Создать новую
Double exposure of mans hands holding and using a phone and financial graph drawing. Analysis concept.
Коллекция по умолчанию
Коллекция по умолчанию
Создать новую
Infographic timeline banner, scheme, chart. Step by step report template. Vector.
Коллекция по умолчанию
Коллекция по умолчанию
Создать новую

Goal business success strategy chart target. Business finance marketing and investment. Stock market graph with man using phone financial profit stock development.
Коллекция по умолчанию
Коллекция по умолчанию
Создать новую
3D Rendering of financial candlestick chart with red and blue bars, light yellow background, concept of stock market data and analysis
Коллекция по умолчанию
Коллекция по умолчанию
Создать новую

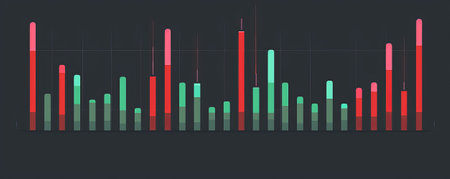
A dynamic bar chart with green and red bars showing stock market gains and losses, with bars of varying heights on a black background for high contrast.
Коллекция по умолчанию
Коллекция по умолчанию
Создать новую

Vector Art Candlestick Chart Market Trends in Blue, Orange, and Yellow on a Dark Background.
Коллекция по умолчанию
Коллекция по умолчанию
Создать новую
The side view of a computer screen displaying multiple financial reports, graphs and pie in corporate office background. beautiful Generative AI AIG32
Коллекция по умолчанию
Коллекция по умолчанию
Создать новую
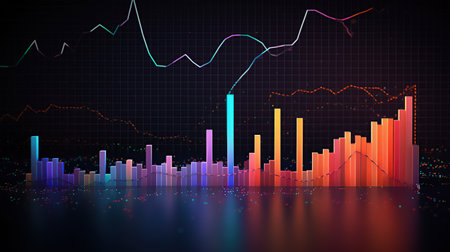
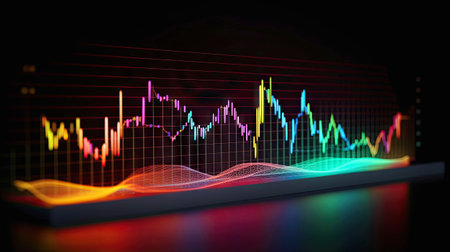
Business finance trading analytic with Neon Bars and Graphs Illuminate. AI generated
Коллекция по умолчанию
Коллекция по умолчанию
Создать новую

Business Graph
Коллекция по умолчанию
Коллекция по умолчанию
Создать новую

Image of world map over data processing. Technology and digital interface concept digitally generated image.
Коллекция по умолчанию
Коллекция по умолчанию
Создать новую

Charts Graphs paper. Financial development, Banking Account, Statistics, Investment Analytic research data economy, Stock exchange Business office company meeting concept.
Коллекция по умолчанию
Коллекция по умолчанию
Создать новую

Goal business success strategy chart target and planning. Stock market, Business growth, progress or success. Stock market graph financial profit stock market development.
Коллекция по умолчанию
Коллекция по умолчанию
Создать новую
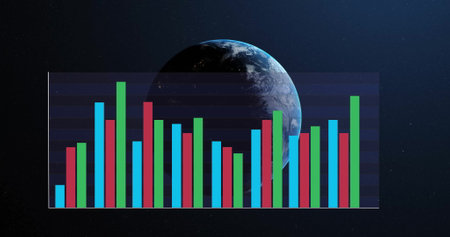
Image of digital data processing over globe on dark background. global connections, computing and data processing concept digitally generated image.
Коллекция по умолчанию
Коллекция по умолчанию
Создать новую
Business graph and chart on table. Business and finance concept. 3D Rendering
Коллекция по умолчанию
Коллекция по умолчанию
Создать новую

Business people are checking business reports.
Коллекция по умолчанию
Коллекция по умолчанию
Создать новую

3d render of futuristic city background. Vector illustration. Eps 10
Коллекция по умолчанию
Коллекция по умолчанию
Создать новую

Business growth concept. 3d rendering.
Коллекция по умолчанию
Коллекция по умолчанию
Создать новую
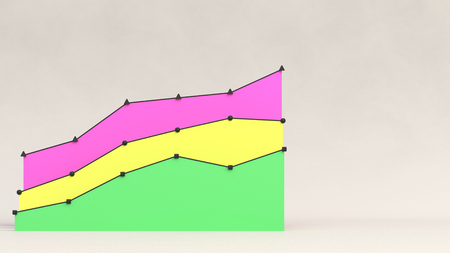
Three colorful rising flat linear diagrams standing behind each other on white background. Infographic mockup. 3D render illustration
Коллекция по умолчанию
Коллекция по умолчанию
Создать новую

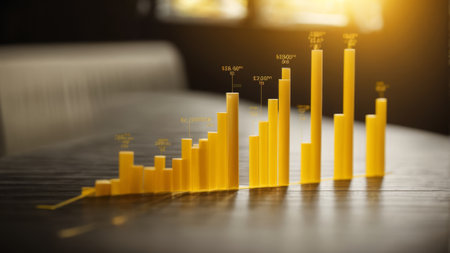
Minimalist 3D bar graph on a solid background, conveying business growth concept
Коллекция по умолчанию
Коллекция по умолчанию
Создать новую
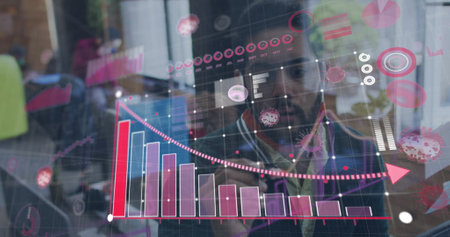
Image of statistics recording and covid 19 cells over man drawing in office wearing face mask. global covid 19 pandemic, health and medicine concept digitally generated image.
Коллекция по умолчанию
Коллекция по умолчанию
Создать новую

Chart graph paper. Finance, account, statistic, investment data economy, stock exchange business.
Коллекция по умолчанию
Коллекция по умолчанию
Создать новую
Коллекция по умолчанию
Коллекция по умолчанию
Создать новую

Icon Colorful bar graph chart. Business illustration isolated sign symbol thin line for web, modern minimalistic flat design vector on blue background
Коллекция по умолчанию
Коллекция по умолчанию
Создать новую
Stock trading graphic design for financial investment trade, Forex graph business or Stock graph line chart market exchange ,Technical price line with indicator on chart computer screen background
Коллекция по умолчанию
Коллекция по умолчанию
Создать новую
Financial data on a monitor,Stock market data on LED display concept
Коллекция по умолчанию
Коллекция по умолчанию
Создать новую

Vibrant minimalist bar graph illustration with yellow and blue bars against black background
Коллекция по умолчанию
Коллекция по умолчанию
Создать новую
graph chart of stock market investment trading.
Коллекция по умолчанию
Коллекция по умолчанию
Создать новую

A bar graph with lights on it and a blurry background, AI
Коллекция по умолчанию
Коллекция по умолчанию
Создать новую

Data visualization icon. Big data, data analysis, analytics concept. 3d render illustration.
Коллекция по умолчанию
Коллекция по умолчанию
Создать новую
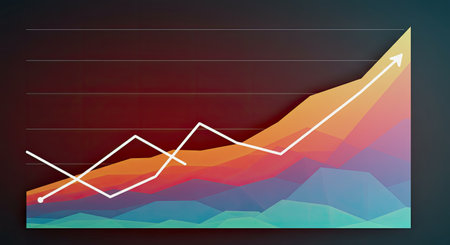
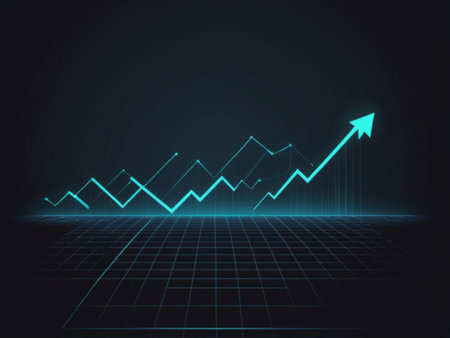
Illustration of a graph with a rising arrow on a dark background
Коллекция по умолчанию
Коллекция по умолчанию
Создать новую
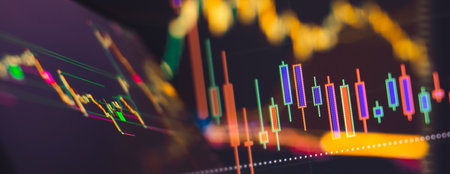
diagrams, financial chart with lines and candlesticks, financial chart with changes. concept of forex.
Коллекция по умолчанию
Коллекция по умолчанию
Создать новую

Image of coronavirus Covid 19 cells with graph statistics recording and data processing on blue background. Coronavirus Covid 19 spreading pandemic concept digitally generated image.
Коллекция по умолчанию
Коллекция по умолчанию
Создать новую

young business man hand graph in screen
Коллекция по умолчанию
Коллекция по умолчанию
Создать новую

Coronavirus Financial Crisis Economic Stock Market Banking Concept. Falling Economy Covid 19
Коллекция по умолчанию
Коллекция по умолчанию
Создать новую
Analysis, chart and screen hologram of stock market, financial management and investment profit
Коллекция по умолчанию
Коллекция по умолчанию
Создать новую

concept of progress in development, financial efficiency and investment with business strategy for goals and opportunities in the industry future ,Businessman showing business growth and success graph
Коллекция по умолчанию
Коллекция по умолчанию
Создать новую
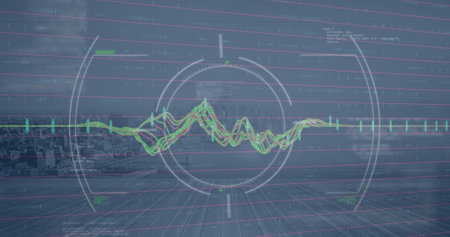
Image of scope scanning over data processing against aerial view of cityscape. Computer interface and business data technology concept
Коллекция по умолчанию
Коллекция по умолчанию
Создать новую

A bar chart with bright orange and blue bars illustrating stock market fluctuations, with the bars moving up and down on a dark gray background.
Коллекция по умолчанию
Коллекция по умолчанию
Создать новую

Stock or business market analysis concept. Business financial or stock market background. Business graph on stock market financial exchange
Коллекция по умолчанию
Коллекция по умолчанию
Создать новую

Man touching a financial results concept on a touch screen with his finger
Коллекция по умолчанию
Коллекция по умолчанию
Создать новую

Stock market graph and table with computer background. Double exposure. Concept of financial analysis.
Коллекция по умолчанию
Коллекция по умолчанию
Создать новую

Stock Market Trading Chart Investment Analysis Business Index Chart Finance Board Chart
Коллекция по умолчанию
Коллекция по умолчанию
Создать новую

Data analyzing bar graph dynamic up arrow business statistic increase 3d icon realistic vector illustration. Chart diagram achievement success analytics efficient management productivity work
Коллекция по умолчанию
Коллекция по умолчанию
Создать новую
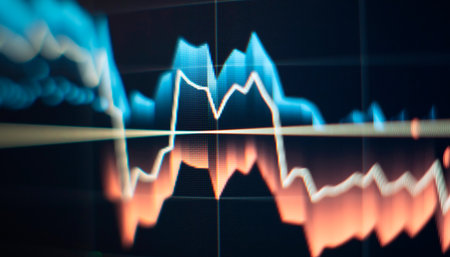
A colorful abstract representation of a stock market chart. The graph is a visual representation of financial data and trends.
Коллекция по умолчанию
Коллекция по умолчанию
Создать новую
Statistics Strategy Analysis Diagram Information Concept
Коллекция по умолчанию
Коллекция по умолчанию
Создать новую

Digital composite of Man looking through binoculars against grey background with arrows
Коллекция по умолчанию
Коллекция по умолчанию
Создать новую
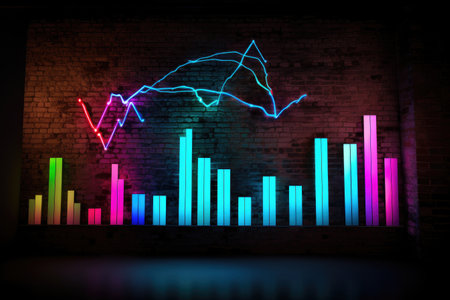
A striking neon colored bar chart displayed on a wall, providing a visually captivating representation of data analysis, Neon graffiti version of a rising stock market graph, AI Generated
Коллекция по умолчанию
Коллекция по умолчанию
Создать новую
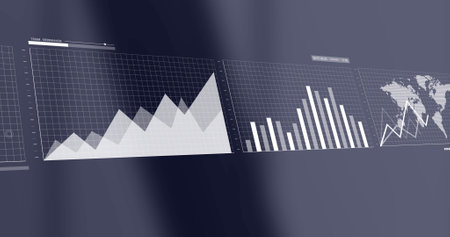
Image of interface with statistical data processing against grey background. Computer interface and business data technology concept
Коллекция по умолчанию
Коллекция по умолчанию
Создать новую
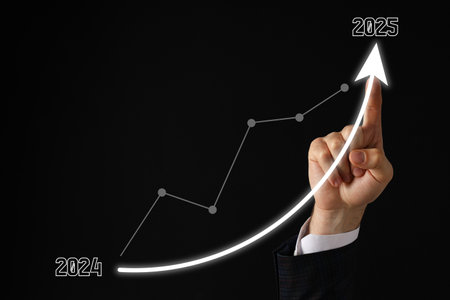
Goals 2025, the concept of planning and calculating the strategy for the next year.
Коллекция по умолчанию
Коллекция по умолчанию
Создать новую
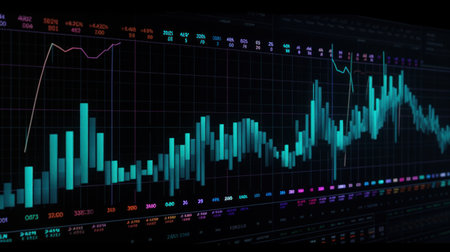
Stock market or forex trading graph and candlestick chart suitable for financial investment concept. Economy trends background
Коллекция по умолчанию
Коллекция по умолчанию
Создать новую

Candle stick graph chart of stock market investment trading.
Коллекция по умолчанию
Коллекция по умолчанию
Создать новую

multi color bar charts with two different pencils
Коллекция по умолчанию
Коллекция по умолчанию
Создать новую
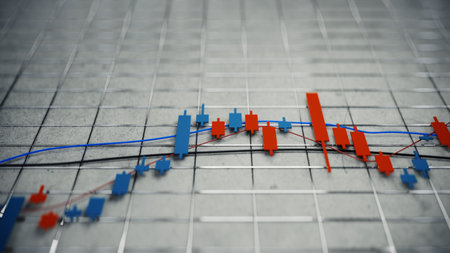
stock market candle stick chart, 3d rendering
Коллекция по умолчанию
Коллекция по умолчанию
Создать новую
Legion-Media
Создайте свои проекты на основе качественных стоковых фотографий и видео.


Copyright © Legion-Media.